Step 3
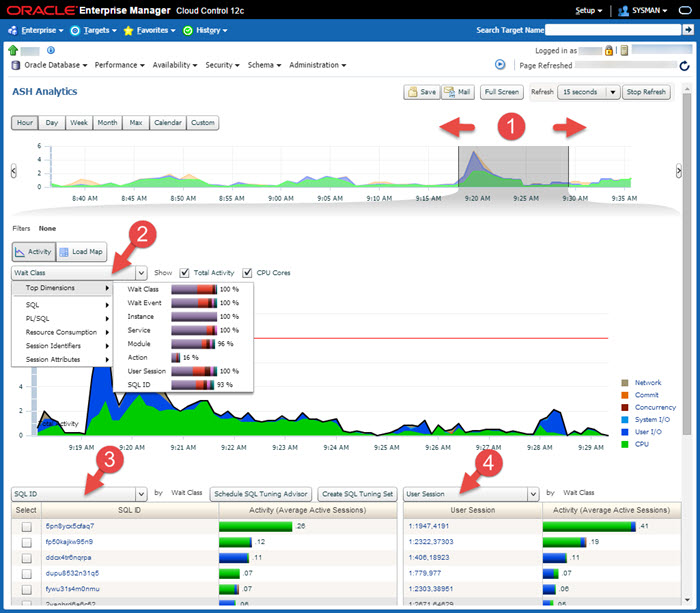
The dropdowns contain the following metrics.
- Top Dimensions : Wait Class, Wait Event, Instance, Service, Module, Action, User Session, SQL ID
- SQL : SQL ID, Top Level SQL ID, SQL Force Matching Signature, SQL Plan Hash Value, SQL Plan Operation, SQL Plan Operation Line, SQL Opcode, Top Level SQL Opcode
- PL/SQL : PL/SQL, Top Level PL/SQL
- Resource Consumption : Wait Class, Wait Event, Object, Blocking Session
- Session Identifiers : Instance, Service, User Session, Parallel Process, User ID, Program, Session Type
- Session Attributes : Consumer Group, Module, Action, Client, Transaction ID, Execution Context ID
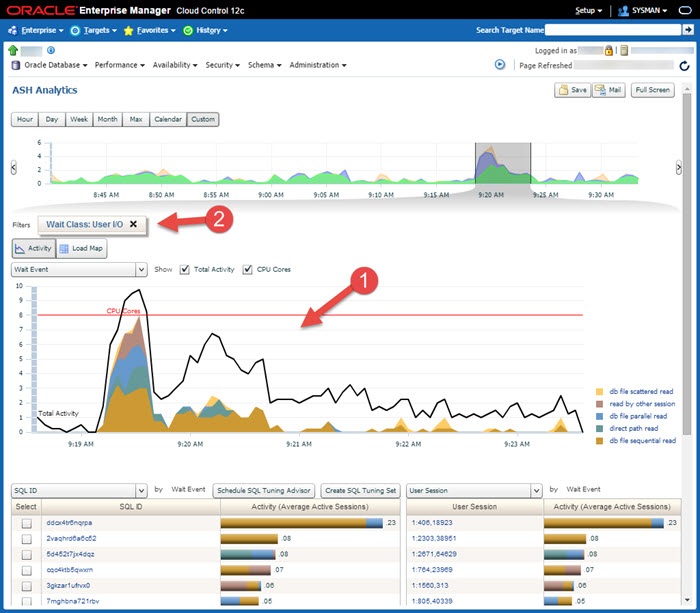
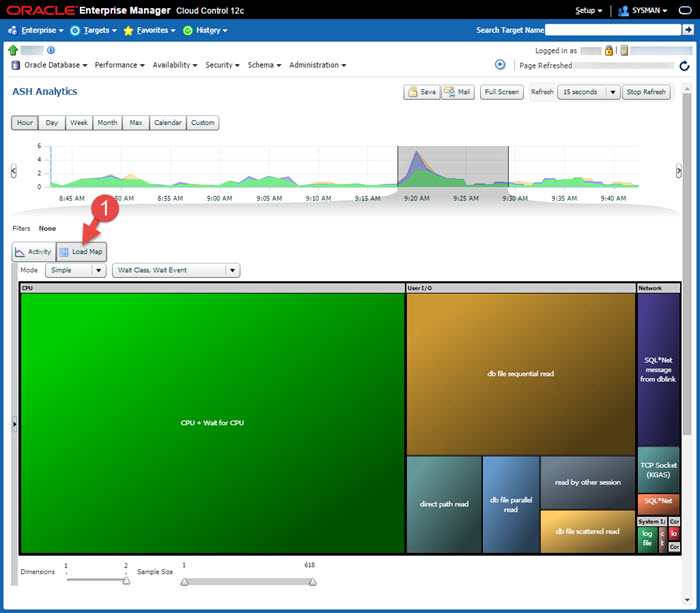
- Hovering over the expanded activity graph will highlight the section you are above. Clicking it will apply a filter and redraw the graph based on that filter.
- The filter can be removed by click the "X" on the filter.