DBA Hub

📋Steps in this guide1/8

Generate performance report in postgres using pg_profile - DBACLASS DBACLASS

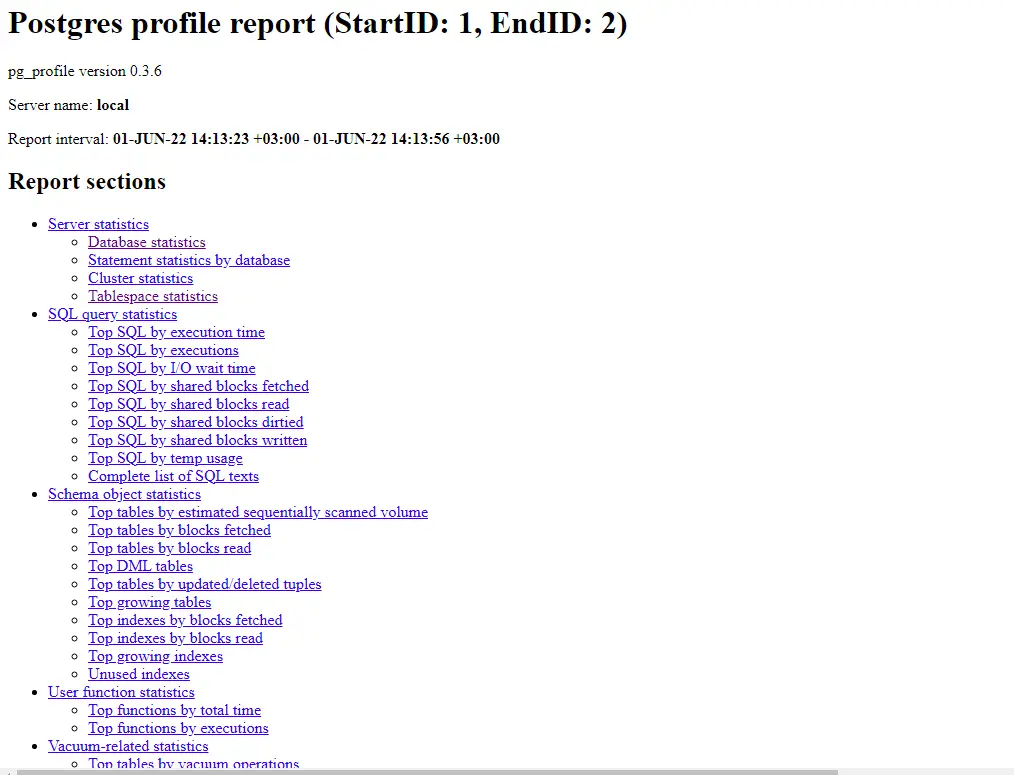
Generate performance report in postgres using pg_profile , just like awr in oracle database. Download the extension from github.

postgresql configurationintermediate
by PostgreSQL
11 views
1

1. Download and install pg_profile

Download the extensions file from github link – > https://github.com/zubkov-andrei/pg_profile/releases Copy to server and unzip to the below location.

Code/Command (click line numbers to comment):

1
2
3
4
5
6
7
8
9
10
11
12
13
14
[root@~]# cd /usr/edb/as12/share/extension/
[root@extension]# ls -ltr *gz
-rw-r--r-- 1 root root 186808 Jun 1 14:06 pg_profile--0.3.6.tar.gz
[root@extension]# tar xzf pg_profile--0.3.6.tar.gz --directory /usr/edb/as12/share/extension/
[root@extension]# ls -ltr
total 3928
-rw-r--r-- 1 root root 2259 Nov 24 2019 pldbgapi--unpackaged--1.1.sql


--Connect with super user and create the extension:

postgres=# <span style="color: #800000;"><strong>CREATE EXTENSION pg_profile;

</strong></span>
2

2. verify the parameter setting:

Make sure highlighted parameters are set as below.

Code/Command (click line numbers to comment):

1
2
3
4
5
6
7
8
9
10
postgres=# <span style="color: #800000;"><strong>select name,setting from pg_settings where name like 'track%';</strong></span>
           name            | setting
---------------------------+---------
 track_activities          | on
 track_activity_query_size | 1024
 track_commit_timestamp    | off
 track_counts              | on
 track_functions           | all
 track_io_timing           | on
(6 rows)
3

3. Create dependent extension:

pg_stat_statement extension: For a better performance report with sql statement details, you need to have pg_stat_statement extension in your postgres setup. Please use the link to know the steps to install pg_stat_statement extension dblink: Using pg_profile,  you can generate performance report of remote server also. So you need to have dblink extension also. So create the extension using below statement:

Code/Command (click line numbers to comment):

1
CREATE EXTENSION dblink;
4

4. Verify that all extensions are present now:

Code/Command (click line numbers to comment):

1
2
3
4
5
6
7
8
postgres=# <span style="color: #800000;"><strong>\dx</strong></span>
                                        List of installed extensions
        Name        | Version |   Schema   |                          Description
--------------------+---------+------------+----------------------------------------------------------------
 dblink             | 1.2     | public     | connect to other PostgreSQL databases from within a database
 pg_profile         | 0.3.6   | public     | PostgreSQL load profile repository and report builder
 pg_stat_statements | 1.7     | public     | track execution statistics of all SQL statements executed
(14 rows)
5

5. Verify server details:

By default local server will be added in the server list.

Code/Command (click line numbers to comment):

1
2
3
4
5
postgres=# <span style="color: #800000;"><strong>select * from show_servers();</strong></span>
 server_name |          connstr          | enabled | description
-------------+---------------------------+---------+-------------
 local       | dbname=postgres port=5444 | t       |
(1 row)
6

6. Gather sample for local:

To generate a report, you need atleast two sample. 7. Generate performance report: 1 and 2 are the sample id. Below is the html performance  file generated.
Step 6

Code/Command (click line numbers to comment):

1
2
3
4
5
6
7
8
9
10
11
12
13
14
15
16
17
18
19
20
21
22
23
24
25
26
27
28
29
30
31
32
33
34
35
36
37
38
39
40
postgres=# <span style="color: #800000;"><strong>select * from show_samples;</strong></span>
 sample | sample_time | sizes_collected | dbstats_reset | clustats_reset | archstats_reset
--------+-------------+-----------------+---------------+----------------+-----------------
(0 rows)

postgres=# <span style="color: #800000;"><strong>select * from take_sample();</strong></span>
 server | result |   elapsed
--------+--------+-------------
 local  | OK     | 00:00:00.48
(1 row)


postgres=# <span style="color: #800000;"><strong>select * from show_samples;</strong></span>
 sample |        sample_time        | sizes_collected | dbstats_reset | clustats_reset | archstats_reset
--------+---------------------------+-----------------+---------------+----------------+-----------------
      1 | 01-JUN-22 14:13:23 +03:00 | t               |               |                |
(1 row)


--- after doing some transaction.


postgres=#  <span style="color: #800000;"><strong>select * from take_sample();</strong></span>
 server | result |   elapsed
--------+--------+-------------
 local  | OK     | 00:00:00.44
(1 row)

postgres=# <span style="color: #800000;"><strong> select * from show_samples;</strong></span>
 sample |        sample_time        | sizes_collected | dbstats_reset | clustats_reset | archstats_reset
--------+---------------------------+-----------------+---------------+----------------+-----------------
      1 | 01-JUN-22 14:13:23 +03:00 | t               |               |                |
      2 | 01-JUN-22 14:13:56 +03:00 | t               |               |                |
(2 rows)

-bash-4.2$ <span style="color: #800000;"><strong>psql -d postgres  -Aqtc "SELECT  get_report('local',1,2)" -o 1st_report.html
</strong></span>
7

8. Creating performance report for remote servers:

If you want to generate report of postgres cluster on remote server, then you need to add that in server list .

Code/Command (click line numbers to comment):

1
2
3
4
5
6
7
8
9
10
11
12
13
14
15
16
17
18
19
20
21
22
23
24
25
26
27
28
29
30
31
32
33
34
35
36
37
38
39
40
41
42
43
44
45
46
47
48
49
50
51
52
53
54
55
56
57
58
59
60
61
62
First you need to add the server.

postgres=# <span style="color: #800000;"><strong>SELECT create_server('elmtest','host=10.20.30.131 dbname=postgres port=5444');</strong></span>
 create_server
---------------
             2
(1 row)

Update the .pgpass file, with remote server details(ip,port,super user ,password)

-bash-4.2$ cat .pgpass
10.20.30.131:5444:*:enterprisedb:elm#912345


postgres=# <span style="color: #800000;"><strong>select * from show_servers();</strong></span>
 server_name |                   connstr                    | enabled | description
-------------+----------------------------------------------+---------+-------------
 elmtest     | host=10.20.30.131 dbname=postgres port=5444  | t       |
 local       | dbname=postgres port=5444                    | t       |
(2 rows)


Now take sample

-- This will generate sample for all servers.
postgres=#  <span style="color: #800000;"><strong>select * from take_sample();</strong></span>
 server  | result |   elapsed
---------+--------+-------------
 elmtest | OK     | 00:00:00.63
 local   | OK     | 00:00:00.51
(2 rows)

-- If you need to generate sample for specific server, then pass that value in take_sample() like,

postgres=#  <span style="color: #800000;"><strong>select * from take_sample('elmtest');</strong></span>
 server  | result |   elapsed
---------+--------+-------------
 elmtest | OK     | 00:00:00.63
(1 rows)


-- Show sample id for remote server elmtest:
postgres=#  <span style="color: #800000;"><strong>select * from show_samples('elmtest');</strong></span>
 sample |        sample_time        | sizes_collected | dbstats_reset | bgwrstats_reset | archstats_reset
--------+---------------------------+-----------------+---------------+-----------------+-----------------
      1 | 03-JUN-22 21:55:05 +03:00 | t               |               |                 |
(1 row)


--- Show sample id for all servers:

postgres=# <span style="color: #800000;"><strong>select * from show_samples;</strong></span>
 sample |        sample_time        | sizes_collected | dbstats_reset | clustats_reset | archstats_reset
--------+---------------------------+-----------------+---------------+----------------+-----------------
      1 | 01-JUN-22 14:13:23 +03:00 | t               |               |                |
      2 | 01-JUN-22 14:13:56 +03:00 | t               |               |                |
      3 | 01-JUN-22 14:55:35 +03:00 | t               |               |                |
      4 | 01-JUN-22 22:41:08 +03:00 | t               |               |                |
      5 | 01-JUN-22 22:42:18 +03:00 | t               |               |                |
      6 | 03-JUN-22 19:02:35 +03:00 | t               |               |                |
      7 | 03-JUN-22 21:55:05 +03:00 | t               |               |                |
(7 rows)
8

9.Setting retention period of samples:

We cannot keep the sample ids forever as it will consume storage space. So better to set retention period like 30 days/60 days. So you can set max_sample_age for servers using below command. REFERENCE – https://github.com/zubkov-andrei/pg_profile/blob/master/doc/pg_profile.md

Code/Command (click line numbers to comment):

1
2
3
4
5
6
7
8
9
10
11
12
13
14
15
16
17
18
19
20
21
22
23
24
25
26
27
28
29
30
31
32
33
34
35
36
37
38
39
40
41
42
43
44
45
46
47
48
49
50
51
52
53
54
55
56
57
58
59
60
- 30 means 30 days.

postgres=# <span style="color: #800000;"><strong>select set_server_max_sample_age('elmtest',30);</strong></span>
set_server_max_sample_age
---------------------------
1
(1 row)

However there is another concept called baseline, i.e support you want to keep a specific range of sample for a specific duration , then you can create baseline as below.

<span style="text-decoration: underline;"><strong>NOTE</strong></span>- - Baseline retention overwrites the max_sample_age setting

-- Create baseline,

elmtest - server_name,
plm_base1 - baseline_name,
1 and 2 are start and end sample range.
30 - retention period.

postgres=# <span style="color: #800000;"><strong>select create_baseline('elmtest','plm_base1',1,2,30);</strong></span>
create_baseline
-----------------
5
(1 row)

-- Show baselines:


postgres=#<span style="color: #800000;"><strong> select * from show_baselines();</strong></span>
 baseline | min_sample | max_sample |      keep_until_time
----------+------------+------------+---------------------------
 local2   |          1 |          4 | 01-JUL-22 22:44:44 +03:00
 local    |          1 |          3 | 05-JUN-22 15:15:39 +03:00
(2 rows)

postgres=# <span style="color: #800000;"><strong>select * from show_baselines('elmtest');</strong></span>
 baseline  | min_sample | max_sample |      keep_until_time
-----------+------------+------------+---------------------------
 plm_base1 |          1 |          1 | 05-JUL-22 17:59:33 +03:00
(1 row)
-- Modify baseline retention period:

postgres=# <span style="color: #800000;"><strong>select keep_baseline('elmtest','plm_base1',50);</strong></span>
 keep_baseline
---------------
             1
(1 row)

postgres=# <span style="color: #800000;"><strong>select * from show_baselines('elmtest');</strong></span>
 baseline  | min_sample | max_sample |      keep_until_time
-----------+------------+------------+---------------------------
 plm_base1 |          1 |          1 | 25-JUL-22 18:00:52 +03:00
(1 row)
-- Drop a baseline:

postgres=#  <span style="color: #800000;"><strong>select drop_baseline('elmtest','plm_base1');
</strong></span> drop_baseline
---------------
             1
(1 row)

Comments (0)

Please to add comments

No comments yet. Be the first to comment!