DBA Hub

📋Steps in this guide1/1

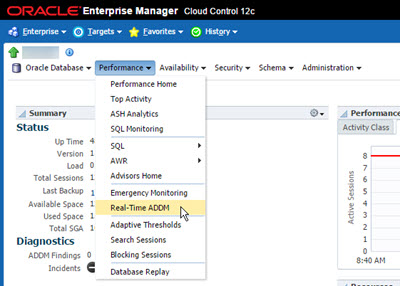
Real-Time Automatic Database Diagnostics Monitor (ADDM) in Oracle Database 12c Release 1 (12.1)

Get up-to-the-minute analysis from ADDM, rather than waiting for the next AWR snapshot.

oracle 12cconfigurationintermediate
by OracleDba
13 views
1

Faking a Problem

The Automatic Database Diagnostics Monitor (ADDM) has been available since Oracle 10g as part of the Diagnostics and Tuning option in Enterprise Edition. ADDM analyzes the contents of the Automatic Workload Repository (AWR) to identify potential performance bottlenecks and attempts to perform root cause analysis of them. Since the AWR snapshots are taken on an hourly basis by default, this has meant ADDM was limited to retrospective analysis on an hourly basis. Enterprise Manager Cloud Control has included functionality to perform real-time ADDM reports for some time. In addition to the existing ADDM functionality, Oracle Database 12c introduced Real-Time ADDM, which identifies potential performance problems as they happen, analyzes them and stores reports, allowing up-to-the-minute diagnosis of performance problems. This functionality requires Enterprise Edition and the Diagnostics and Tuning option. Make sure you have the correct licensing before using this functionality. - Overview - Reports - DBMS_ADDM.REAL_TIME_ADDM_REPORT Function - Faking a Problem Related articles. The manageability monitor (MMON) process kicks in every 3 seconds and checks the performance statistics that are currently in memory. If it notices any potential performance issues, it triggers a real-time ADDM analysis run, creates a report and stores it in the Automatic Workload Repository (AWR). The stored reports can be seen in the view. The documentation lists the potential triggers for a real-time analysis here . Real-time ADDM reports are generated using the "rtaddmrpt.sql" and "rtaddmrpti.sql" scripts in the "$ORACLE_HOME/rdbms/admin" directory. The "rtaddmrpt.sql" script assumes the report is for the current database and instance, and uses a reporting period of the -60 mins to current time (SYSDATE). This sounds a little like a conventional ADDM report, but the information is sourced from the view, not the conventional ADDM analysis. An example of running the "rtaddmrpt.sql" script is shown below. Only the and required user input. You can see the example output here. - rtaddmrpt_0720_1039.html (Your browser may block this as an "unsafe script") The "rtaddmrpti.sql" script allows you to manually select the database and reporting period. The items in bold required user input. You can see the example output here. - rtaddmrpt_0720_1034.html (Your browser may block this as an "unsafe script") The package contains a function called , which looks promising at first glance. > "This function produces a real-time ADDM report for ADDM-related activity for the last five minutes..." Unfortunately, it doesn't return a formatted real-time ADDM report, just some data in XML format. You can see the output using the following query. The reporting scripts described above require records in the view for the analysis period, or they result in the following error. If you are looking at a small test system, you may not have any performance problems to monitor, so you will need to fake some. I did this using Swingbench by running the Order Entry workload and locking the table for a few seconds. For more information see: Hope this helps. Regards Tim...
Step 1

Comments (0)

Please to add comments

No comments yet. Be the first to comment!